

A few days ago the news appeared that the INE (National Institute of Statistics) will carry out a macro study on mobility in Spain, following the movements of all mobiles in Spain. Four working days in November, a Sunday and three days of vacation will be analyzed. The objective of this study is to have information to reinforce public services and transport infrastructure.
Beyond the issues of data privacy, I would like to highlight the concept of #GEO #BIG #DATA. It is often not enough to learn about certain data, we must also know the specific time of the data and where.
Visualizing and obtaining conclusions from spatial data will be increasingly important in the water sector and across the different sectors.
A few days ago I saw on Twitter a significant number of tweets with Hastag # 30DayMapChallenge.
After analyzing the challenge, I decided to try it, with some peculiarities that I will explain below.
- On my twitter I will try to keep up with # 30DayMapChallenge by sharing a map with the theme discussed in the challenge.
- Some of the maps that I will share refer to some of the work I have done throughout my 25 years of professional life. Many jobs related to the Water and Agriculture sector, using GIS tools.
- In some cases, in the tweet I will mention a post from my blog @iagua that is related to the map.
I will explain the four maps that I have shared.
Map 00. Presentation
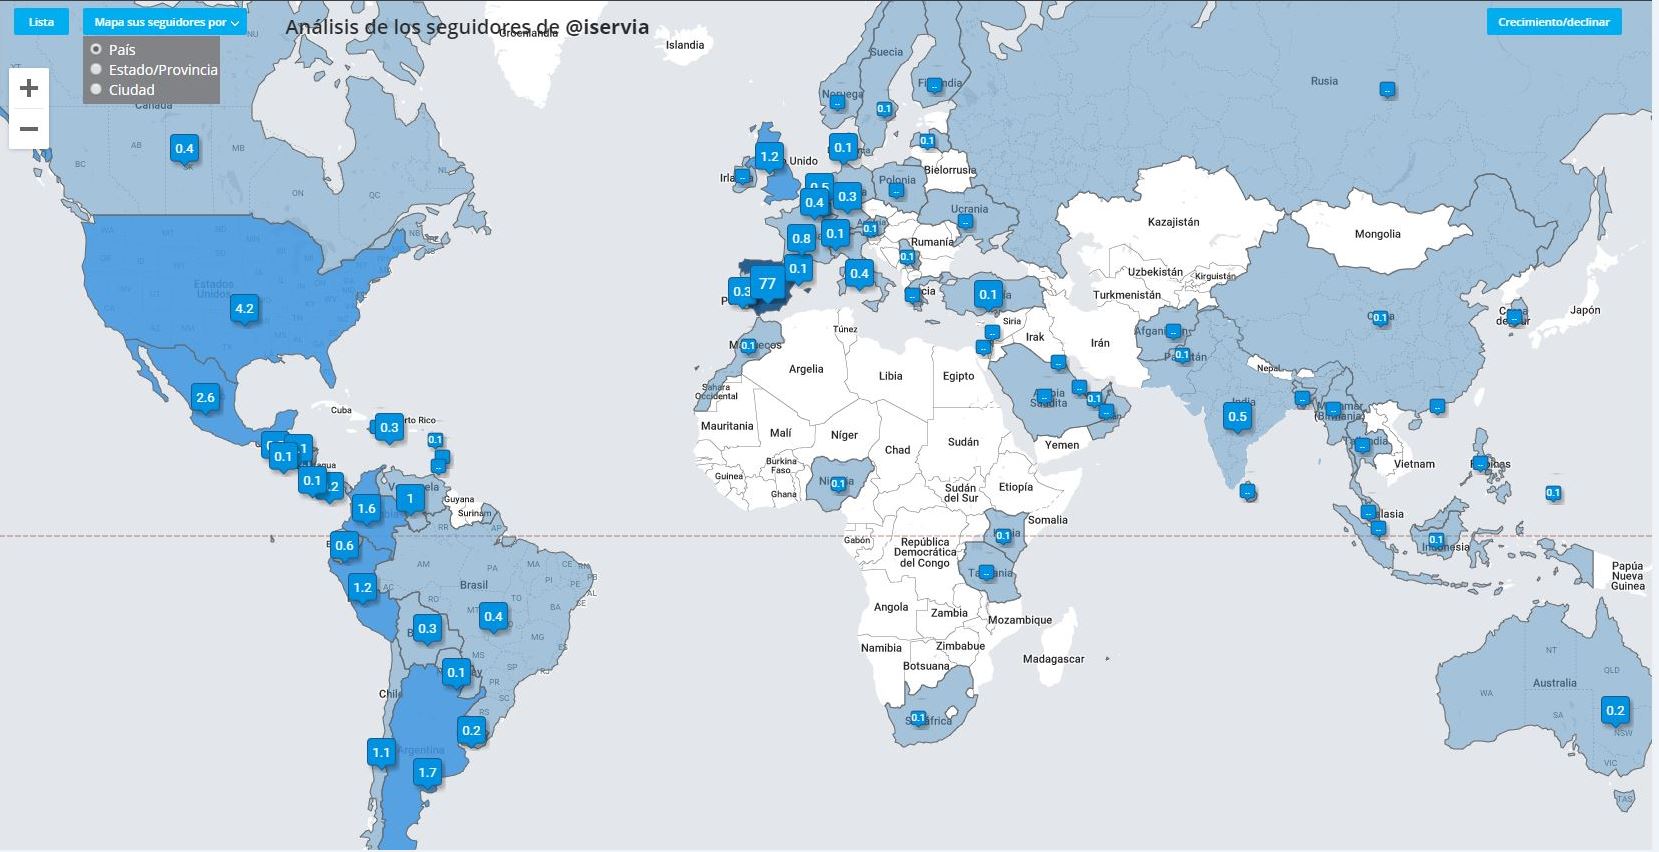
Before starting this challenge I wanted to share a presentation tweet, in which I included my previous post “Who is @iservia?” As well as the @tweepsmap with my followers in different geographical areas.


Map. 01. Points.
The map of points chosen has been the SHP that I used in a project for the city council of Barcelona on the improvement of the soil for the planting of the tree-lined road. It is covered by 156,603 points of the trees of Barcelona.
In the figure you can see how the trees allow to see the geometry of the area of the widening and the diagonal.


Map. 02. Lines.
The map of lines that I have shared is made between 2003 and 2005 and corresponds to the inventory of all irrigation and drainage infrastructures of the General Community of irrigators of the d’Urgell channels, as part of the Modernization Master Plan.
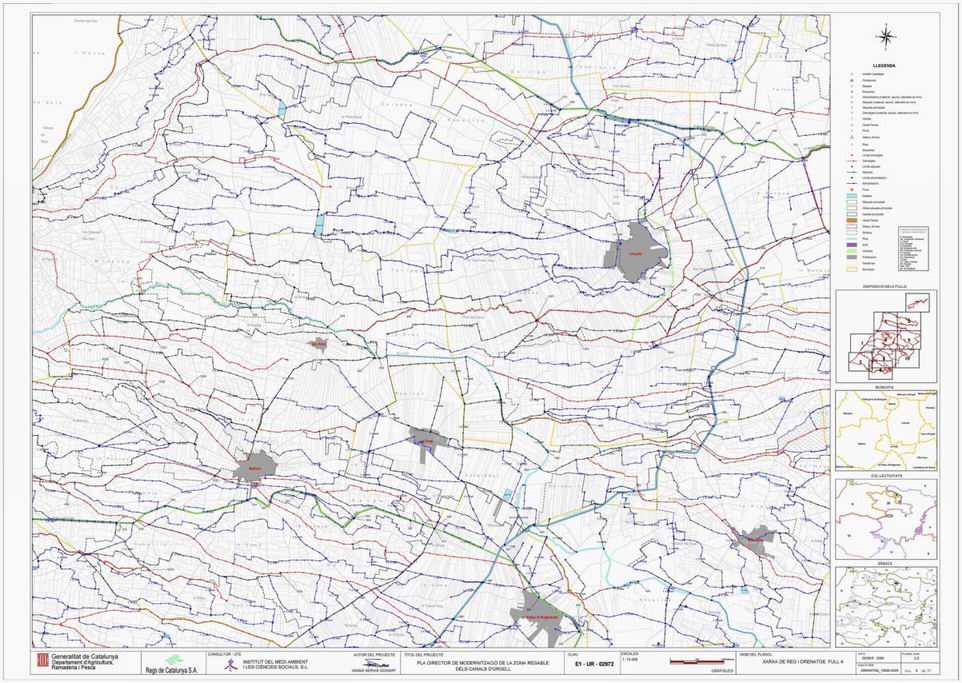
The water post associated with this map is the Irrigation Plan for technicians only.
Map. 03. Polygon.
The map of polygons that I have shared is the Map of Crops of Catalonia of 2019 (644.376 records), published a few weeks ago. It has served as the basis for the post and if the Canal d'Urgell stopped producing corn?

From this post, I invite you to follow this # 30DayMapChallenge on my twitter @iservia.