

1. Water footprint
On November 18, Arjen Hoekstra died at the age of 52, as announced by IHE Delft. Arjen was the creator of the concept of Water Footprint in 2002. I share the link to the news.
A sad news when mentors leave us at an early age. RIP Arjen.

The water footprint is an indicator of the use of fresh water that refers both to the direct use of water from a consumer or producer, and to its indirect use. The water footprint is used to measure the total volume of fresh water used to produce things and services produced by a company, or consumed by an individual or community. Water use is measured in volume of water consumed, evaporated or contaminated, either per unit of time for individuals and communities, or per unit of product for businesses.
The three components:
- Green Water Footprint. Rainwater that is stored in the upper part of the soil, where it evaporates or transpires, and that does not reach surface or groundwater bodies.
- Blue Water Footprint. Water from surface or groundwater bodies that is incorporated into the production chain of any product.
- Gray water footprint. The volume of fresh water required to assimilate the pollutant load and return a body of water to the conditions of quality and natural characteristics of the place where it is located.

Main milestones on water footprint
- Introduction of the concept (Arjen Hoekstra of IHE in 2002)
- Report: Water footprint of nations by UNESCO-IHE (2004)
- Creation in 2008 of the Water Footprint Network.
- The ISO (International Organization for Standardization) launched in 2009. It was published in August 2014.
Nowadays many people know the concept of water footprint, a value of liters of water necessary to produce different foods. Remember that food consumption represents 70% of our water footprint.

Two comments:
- This indicator should help society understand the use of agricultural water for food production. If an apple has a water footprint of 70 liters, this represents a water footprint of 9,800 m3 / ha / year (4 apples / kg and an average production 35,000 kg / ha)
- This indicator assesses, for the 3 components and in a global way, the volume of water. But this volume of water can have a very different cost depending on the origin of agricultural water. Water from desalination or significant pumping can be priced 5 times higher than water from nearby sources. I like to assess what percentage of the costs of a crop represents the water footprint.
2. The increase in digitalization
The phrase ‘as much information as in all previous years has been digitized in the last year’ is increasingly repeated. Every time we digitize more things, and the information we digitize is at a higher resolution (temporal / spatial / spectral …).
The 4th revolution (Industry 4.0) is exponentially increasing the digital data produced by each sector. Agriculture is one of the sectors that uses more water for food production, similarly it can become one of the sectors that produces more data.
It is estimated that in 2013 there were 4,4 ZettaBytes worldwide, and by 2020 this figure will reach 44 Zettabytes. Between 2013 and 2020, digital data has been multiplied by 10.
If we take into account that in 2019 there is a population of 7.550 million people in the world, there is an average of 5,8 Tb / person. The differences between the different countries in the water footprint must be similar to the differences in the digital footprint.
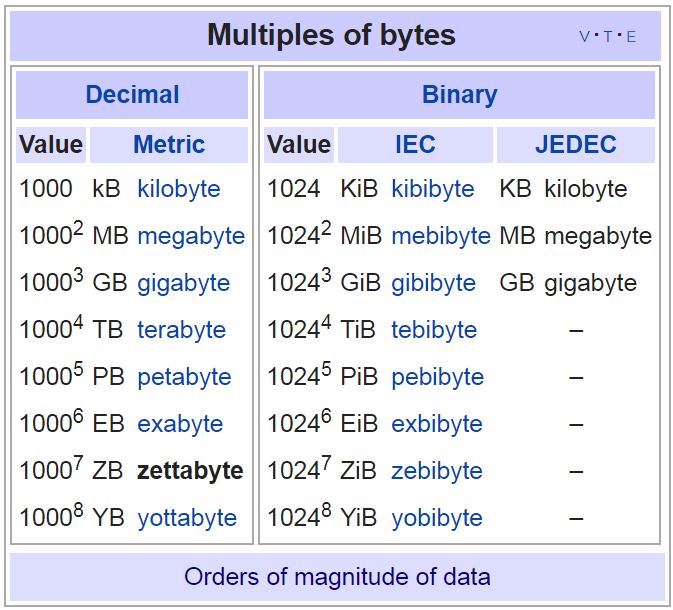
In the following table I present the multiple values of the byte. To cover a volume of information, I give more importance to the unit (order of magnitude) than to the exact value. You have to be aware that information grows exponentially: K, M, G, T, P, E, Z, Y.
Last Tuesday, December 10, I attended the II scientific and technical day of remote sensing and precision agriculture organized by IRTA and the University of Lleida. The various speakers who were making their presentations, each contributed news that meant a significant increase in digital data. So I will give some examples:
- In our platform you can concentrate information on the different cultivation work carried out during the campaign. When planting, hybrid maps, planting dose, elevation, temperature, organic matter, compaction, planting quality, etc. are available.
- Our platform does not use Sentinel images,but uses Planet images to avoid cloud problems (Temporary resolution, from 1 photo every 5 days to 5 photos / week) and improve spatial resolution (from 10×10 m pixel to 3,5×3,5 m resolution).
- To characterize the structure of the crop we use LIDAR technology that can generate 300,000 points per second.
- Our company is working in a group of 4 satellites, which will allow to have a resolution of 30 cm and 2 daily steps, with 6 spectral bands. It is also working on a solar plane, which from a height of 20.000 m can broadcast a live video at a resolution of 18 cm.
Two comments on the conference on digital transformation.
- Practices conducted by research teams are often mixed with innovative techniques that are carried out in commercial plots. Or topics dealing with remote sensing on plant health are addressed by administrations working at the level of trial plots. For farmers / technicians it is important to explain to whom each practice adds value.
- Farmers need a holistic view of the entire digital transformation process. A researcher explains irrigation issues, another plant health, traceability, robotics, etc … Within this holistic vision, the aim is to analyze the cost / benefit of digital transformation.
3. Digital Foodprint
If we ask about the concept of digital footprint, most of us will agree that it is the sum of our activity on the network, and the activity of others talking about us. Although a person is not in the network, he or she can have an important digital footprint.
Have you tried to google yourself to see the shape of your digital footprint?

At this point I would like to introduce a new meaning of the term Digital Footprint, to analyze the efficiency in the use of the data. If the water footprint is the amount of water needed to produce a certain product or service, the digital footprint would be the amount of digital information needed to produce a certain product or service.
In the case of an agricultural holding, a campaign should be assessed:
General information
- ERP
- Processing of declaration / certification
- Marketing
- Cybersecurity (Protection and backups)
- Personnel management.
- Photos and videos.
- Etc.
- Individualized information for each plot.
Irrigation network
- Soil Moisture.
- Satellite images / Plane / Drone.
- Weather station.
- Tasks done with a tractor.
- Estimate of production.
- Robot management.
- Traceability of the product.
- Etc…
Despite what some people say, I believe a greater value of digital footprint is not synonymous with greater profitability, sustainability or efficiency. We are efficient when we manage to convert data into valuable information. It is estimated that less than 0,5% of all data in the world is being analyzed.
The final product should have a value such as x Yb (order of magnitude) to produce an apple or a ton of corn.
In the same way as in the case of the water footprint, in the digital footprint it is also important to know the percentage that represents the cost of digitization.

From here I invite the administration, companies, business schools on digital transformation, agronomist colleagues etc … to estimate a ratio of data use in different types of crops and for agriculture 3.0 vs. 4.0.
Digitization involves a higher percentage of data costs, and a reduction in other costs and / or an increase in product value. But it is important to highlight that the digital footprint must be proportional to the profitability of the products or services.
After consulting different news, it is estimated that the energy consumption of data centers is 2% of the world's energy. Let's not think that since the data centers are in the “cloud” they do not consume energy and are free.