

Trevor Gareth Jones, University of British Columbia
Mangroves are salt-tolerant plants found in intertidal areas throughout much of the world’s tropical and subtropical coastlines. Mangrove ecosystems are highly variable, ranging from sparse, stunted shrubs to dense stands of thick-stemmed tall trees.
These ecosystems provide habitat for an incredibly diverse range of species including fish (from snapper to shark), invertebrates (such as shrimp and crab), reptiles (from snakes to crocodiles), birds (from kingfishers to hawks), primates (such as macaques and lemurs) and even Bengal tigers.
Mangroves also provide essential goods and services to millions living in coastal communities — they prevent shoreline erosion, provide protection from storms, supply food, cooking and building materials, and contain places of cultural and spiritual significance. They are also incredibly carbon dense storing as much or more carbon than their terrestrial forest peers — the majority of this carbon is stored in incredibly deep soils.
Despite their obvious value, aquaculture, agriculture, urban development and unmanaged harvest are converting mangrove ecosystems across much of the tropics. Approximately 35 per cent of global mangrove cover was lost in the 1980s and ‘90s. While the rate of loss slowed in the past two decades — to an estimated four per cent between 1996 and 2016 — many regions remain hotspots for mangrove loss, including Myanmar.
This story is part of Oceans 21
Our series on the global ocean opened with five in depth profiles. Look out for new articles on the state of our oceans in the lead up to the UN’s next climate conference, COP26. The series is brought to you by The Conversation’s international network.
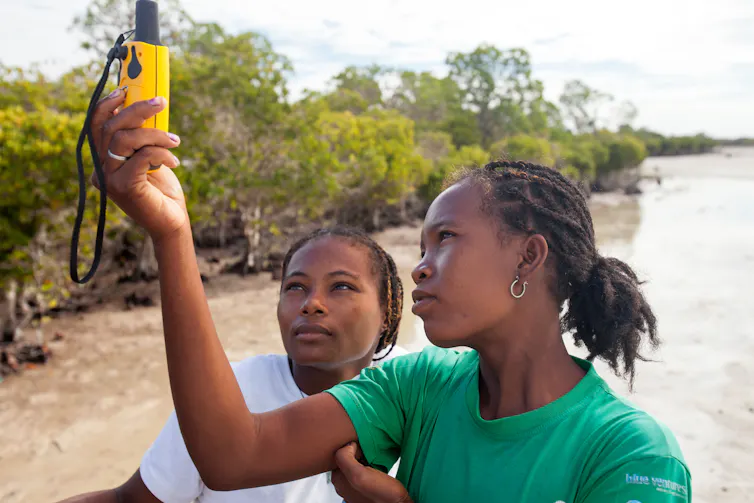
My colleagues and I use satellite imagery and field measurements to study mangrove ecosystems in several countries. We’ve developed an accessible and intuitive tool that provides coastal managers with the accurate, reliable, up-to-date and locally relevant information they need for effective community-based conservation of these critical blue (marine) forests.
New mangrove mapping tool
Until now, information from satellite imagery on mangrove extent and change was either global in coverage and not intended for the smaller areas typically covered by community-based conservation efforts, or — if focused on a local scale — required substantial and costly technical expertise.
As a result, local resource managers often lacked the detail they need to effectively plan for the conservation, restoration and managed-use of mangrove forests, and tap into payments for ecosystem services (PES) programs, and the wealth of climate finance available for forest and blue carbon initiatives.
Our new tool — the Google Earth Engine Mangrove Mapping Methodology (GEEMMM) makes this information freely available to coastal managers and covers the smaller areas they’re concerned with.
The need for a tool like this is enormous. Global products like the Global Mangrove Watch are not intended for local use. And the conventional methods required for local mapping involve a range of technical hurdles including data availability, data processing techniques, computing power and specialized software. All of this remains well beyond the scope of most locally led conservation project budgets.
Our new tool bypasses these barriers and offers an accessible approach to non-specialists including a comprehensive, step-by-step workflow. It requires no specialized expertise with satellite imagery, data processing or coding. The tool only requires basic computer skills, a relatively stable internet connection, and an understanding of the key steps for mapping mangroves.
Piloting the new tool
To pilot our new mangrove mapping tool, we used Myanmar — a global loss hotspot — as a case study. This loss is mostly happening due to widespread conversion for agriculture, such as rice, oil palm and rubber, and for aquaculture, primarily shrimp.
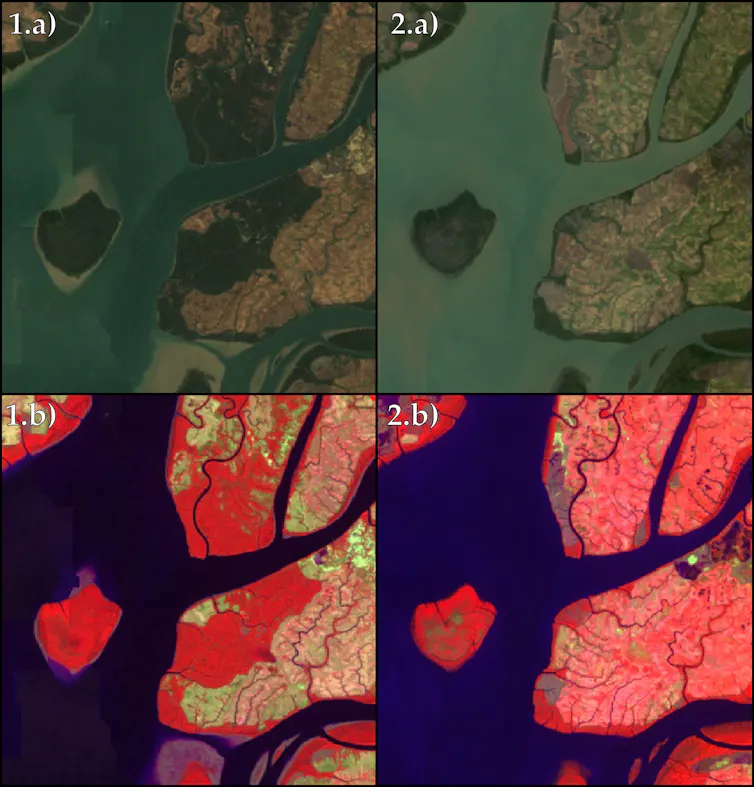
The tool produces current and historic maps of mangrove extent, assesses the quantitative and qualitative accuracy of these maps, and calculates the amount of change that has occurred within a given area of concern. Our results show an alarming 35 per cent loss of mangroves throughout coastal Myanmar since 2004.
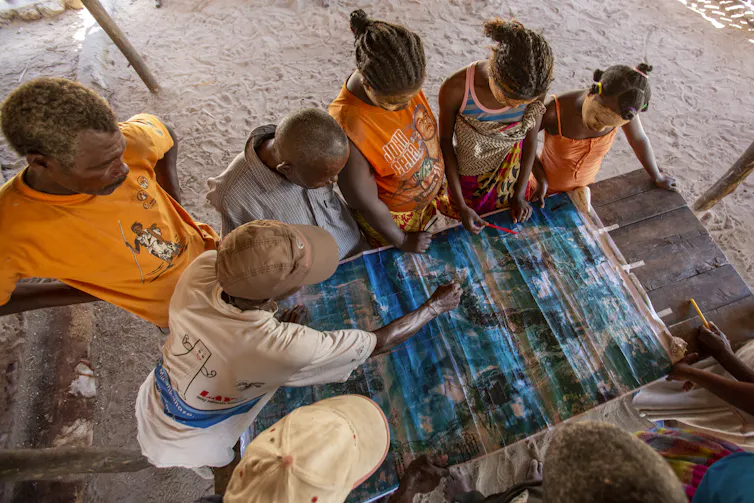
My colleagues in Madagascar are further testing the new tool along the country’s west coast where 21 per cent of the island’s mangroves — an area equivalent in size to 80,000 soccer fields — were lost between 1990 and 2010.
Mangroves are a threatened ecosystem in Madagascar, and understanding where they are — and how they’re being used — is crucial for coastal communities. “These communities need to be supported with the use of a simple monitoring tool that is adaptable to the local context,” said Cicelin Rakotomahazo, the coordinator for Blue Forests in Andavadoaka, Madagascar.
Our new mangrove mapping tool is freely accessible online to non-profit users and runs in Google Earth Engine with detailed instructions. The tool offers locally relevant information and removes key technical barriers for use, providing a ready-to-go approach through which coastal managers can use their local knowledge to map mangrove ecosystems anywhere they are found. Those using the tool also play a role in testing and shaping its development.
Healthy mangroves protect people from waves and storms, prevent coastal erosion, and serve as a nursery for fish and invertebrates. They provide shelter for local and migratory birds, and hunting grounds for primates and reptiles. They store significant amounts of carbon, making serious contributions towards global climate change mitigation.
The communities that live in and around mangrove ecosystems are their biggest advocates, and this new mangrove mapping tool (GEEMMM) offers a tangible contribution towards local mangrove conservation, restoration and managed use.![]()
Trevor Gareth Jones, Adjunct Professor of Forest Resources Management and MGEM Program Advisor, University of British Columbia
This article is republished from The Conversation under a Creative Commons license. Read the original article.