The St. Johns River Water Management District (SJRWMD) is one of the five water management districts in the state of Florida. As an environmental regulatory agency, the district focuses on protecting natural resources and ensuring the sustainable use of Florida’s water for the benefit of the people of the district and the state.
One important group at SJRWMD is the water quality monitoring program team. As its core mission, this team is committed to protecting and restoring water quality through monitoring and reporting, which in turn enables the entire district and its stakeholders to make decisions based on accurate and timely information.
The water quality data quality assurance team at SJRWMD manages a large amount of water quality data, both discrete and continuous, for its surface and groundwater monitoring programs. With over 40 continuous monitoring stations, over 1 million data points collected each year, 800 time-series, and over 900 discrete surface and groundwater monitoring stations, it has always been essential for this group to have confidence in the quality of its data.
Challenge: Decentralized data of varying quality in a dated system
SJRWMD was finding it time consuming and difficult to centralize their water quality data with its field visit data. “One of my first tasks after stepping into a leadership role with the water quality data quality assurance team in 2016 was to figure out how to tackle quality assuring our continuous water quality data,” explained Dr. Margaret Guyette, technical program manager for the Water Quality Monitoring Program at SJRWMD. “There was so much data – because we were getting hourly continuous water quality data into our system that amounted to over 7,000 daily data points – but no efficient way to manage and quality assure it all. We wanted to be more confident in our data, so we started to explore other data management options.”
Some of the challenges SJRWMD faced included the difficulty to quality assure its data, perform drift checks and correct data efficiently. The district also wanted to use the same tried and tested robust tools that the USGS and other agencies have adopted. Together these issues were consuming valuable staff time.
SJRWMD’s application development team was already overextended and the team was not able to use in-house staff to write custom software. Dr. Guyette said, “We wanted an off-the-shelf product that had built-in functionality around quality assurance and corrections, and that would also provide us with self-serve analytics and better insight into our data.” This led to SJRWMD migrating over to the AQUARIUS platform, an analytics software tool by Aquatic Informatics that gathers, processes and models data in real time. It also has a powerful data correction tool that is in use by the USGS and other SJRWMD partners.
Solution: An efficient, accurate platform that is intuitive to use
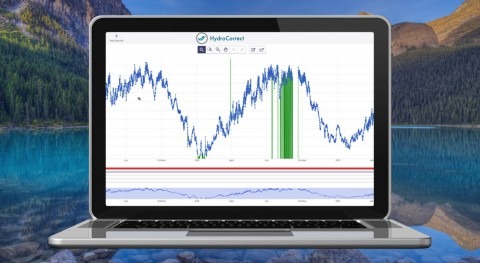
AQUARIUS streamlines the management of continuous water data with powerful data processing tools and automates storage, processing and workflows. For example, the way in which modifications are saved has provided SJRWMD with the added benefit of a historical data trail, keeping both the updated and original values. “When we modified time series in our old system, it was not as easy to interact with the original raw data,” said Dr. Guyette. “Now we can very clearly see both the raw data and any modifications that we’ve made, which is very useful for future reference. It’s also much easier to flag bad data when we see it.”
Data accessibility is easily achieved with AQUARIUS WebPortal and its custom dashboards improve communications with internal stakeholders, which include field staff, project managers, and scientists. The modern dashboard approach improves team accessibility and understanding of continuous water quality data, and more specifically, how things change over time. The value of an easy-to-understand dashboard and quick access to historical data helps in short-term response times and longer term decision-making based on the predictability of trends.
Customizable alerts push critical data notifications to the necessary staff when action needs to be taken. “The alerts allow us to stay on top of things,” explained Dr. Guyette. “If, for whatever reason, any data is more than 6 hours past due from a station, the system automatically alerts our field technicians via email alerts.”
SJRWMD has also set up alerts to inform the team of certain events, such as low dissolved oxygen. “These kinds of alerts give our project managers a ‘head’s up,’ because low dissolved oxygen may lead to fish kills. It’s important that our staff know what’s going on at all times,” Dr. Guyette said.
Dr. Guyette has customized a number of dashboards that are useful to staff members who collect data and troubleshoot station problems. SJRWMD has three kinds of dashboards used for diagnostics and data visualization. The first type (figure 1), the status dashboard, visually represents the major parameters that they measure with probes at each station. This determines if any data is overdue and by how long and also if data is being suppressed or if one of the probes is down, and more. The second type (figure 2) of dashboard graphs a 7-day timeline for every parameter of interest, which includes parameters such as battery voltage. Finally, the third type (figure 3) shows 30-day snapshots of groups of stations, which makes it easier for staff to see changes that have been happening over a longer period of time. “Dashboards should be the first place our field staff look to assess our continuous stations,” Dr. Guyette said.
Though the team at SJRWMD is currently only using the AQUARIUS WebPortal internally, it can also be used as a public-facing portal, allowing municipalities to share water quality data with the public and external stakeholders.
SJRWMD has areas in the district, such as the Indian River Lagoon and St. Johns River, which are actively monitored for algal blooms. In warmer months, a group from the Florida Department of Environmental Protection (FDEP) send out daily emails to important stakeholders including senior managers from multiple agencies. These emails include data snapshots from the District’s continuous water quality monitoring stations. “People are tapping into our data daily to make decisions, and that’s one of the reasons why it’s critical for us to be on top of our data,” Dr. Guyette said. “If we didn’t have a clear, centralized system with alerts and easy-to-use dashboards, the whole process would be much harder to manage.”
Knowing in real time when problems occur results in a higher chance of solving a problem before it triggers a larger regulatory problem. Having confidence in the accuracy of this data is vital. Centralizing water quality data also reduces administrative time spent on filling requests from stakeholders. “Our whole quality assurance process has improved,” said Dr. Guyette. “Everything is all in one place, including our field visit data. Overall, the system is easy to navigate and accessible even to our staff who are less tech savvy.”


