Last month, an international team of scientists, including Berkeley Lab’s William Riley and Qing Zhu, published an update on the global methane budget as part of the Global Carbon Project. They estimated annual global methane emissions at nearly 570 million tons for the 2008 to 2017 decade, which is 5% higher than emissions recorded for the early 2000s and the equivalent of 189 million more cars on the world’s roads.
Anthropogenic sources like agriculture, waste, and fossil fuels contributed to 60% of these emissions, while wetlands made up for the largest natural source of methane. Riley, a Berkeley Lab senior scientist, focuses on modelling how terrestrial ecosystems – such as wetlands – interact with climate. Working with Zhu, they built one of the computer models that allows scientists to quantify these methane emissions from wetlands at global scale.
Although global wetland methane emissions remained largely unchanged between the last decade and the early 2000s, these landscapes have continued to introduce some of the greatest uncertainties in estimating the global methane budget. Riley explains his team’s involvement in the Global Carbon Project and their efforts to reduce this uncertainty.
Q. What is the Global Carbon Project and how did you get involved?
It’s a loosely structured group of international scientists working since 2001 to build global budgets for greenhouse gases, among other efforts. These budgets include carbon dioxide, methane, and nitrous oxide. A lot of the work is focused on characterizing these budgets, understanding why they may be changing, and what the scientific community can do to estimate them better.
As part of the Reducing Uncertainty in Biogeochemical Interactions through Synthesis and Computation project (RUBISCO), which is a Scientific Focus Area at Berkeley Lab, we work on global carbon budgets. The Berkeley Lab group built one of the original global wetland methane models, and that’s why we were asked to participate in the Global Carbon Project.

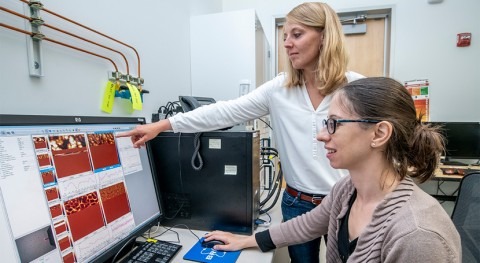
Berkeley Lab scientist Bill Riley studies how terrestrial ecosystems interact with climate and climate change. (Credit: Berkeley Lab)
Q. Why should we care about methane?
Methane is emitted from a range of anthropogenic sources like landfills, agriculture, and fossil fuels, as well as natural systems like wetlands. It is the second most important greenhouse gas that humans are contributing to. Since pre-industrial times, increases in atmospheric methane have contributed to a quarter of the climate-warming effect from greenhouse gases. That’s big.
But unlike carbon dioxide, methane has a shorter lifetime in the atmosphere. If we make big changes in our emissions, methane can be removed relatively quickly.
Q. Are methane emissions hard to estimate?
There are many methane sources. In order to draw up a budget you need to add them all up. We can reasonably estimate the contributions of human-caused methane emissions. However, it’s hard to estimate methane emissions from biogenic sources like wetlands, which are estimated to make up 20% to 30% of the global methane emissions budget.
In wetlands, methane is produced from microbial activity. Once it’s produced, there are multiple pathways in which methane is consumed and transported from the soil to the atmosphere: plants, bubbling, and diffusion. All of these processes are uncertain in their own right and putting them together makes it hard to make predictions. Plants, for example, can draw methane out of the soil and directly release it into the atmosphere, bypassing the oxidation step that’s otherwise active at the soil-air interface when land isn’t submerged. It’s a more complicated set of physical and biological processes compared to modelling and predicting carbon dioxide emissions.
It’s also challenging to identify how much land area is under wetlands from satellite images. The coverage of transient wetlands, for instance, can change over a season or over multiple years because of drainage. Also, wetlands often have emergent vegetation, which can complicate remote sensing estimates.
We’ve estimated annual emissions totaling over 110 million tons from tropical wetlands versus about 10 million tons from the high latitudes
Q. What is your team’s contribution toward making better emission estimates from wetlands?
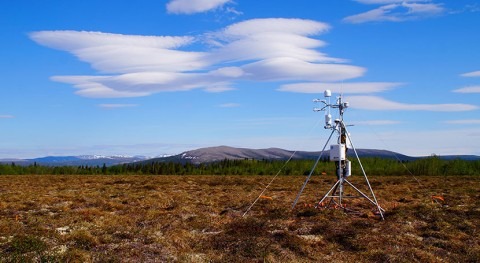
As part of the Global Carbon Project, there are 13 major modeling centers using 13 independent models to estimate wetland methane emissions, and we are one of those groups. Our model, which is integrated in Department of Energy’s Earth system model, E3SM (Energy Exascale Earth System Model), represents widely distributed wetlands and includes many processes that are relevant to these landscapes. As with other models, variables like temperature, precipitation, and methane emissions data collected continuously from 80 wetland sites that are part of the global FLUXNET network are used to evaluate and improve the model. Within those site-level comparisons, we also include information on wetland type: fens, swamps, bogs, etc.; vegetation, which is the carbon input into the system; microbial activity; along with estimates of water table depth, which is a strong controller of methane emissions.
This information allows us to evaluate a wide range of processes and interactions that ultimately influence our emission estimates. But these complex biological processes also introduce a large uncertainty range in methane emission predictions. Our aim was to build a model that represents these important processes in a relatively mechanistic way that can be tested directly against observations from the field.
Q. Do we know if some models perform better than others?
It is still not clear which approach is best. But I think there is value in using the full spectrum of models, from the simplest to the most nuanced. Eventually, we are all hoping to improve the predictability of methane emissions from wetlands.
The final emissions reported in the paper is an average of estimates from each of the 13 models.

Q. Are wetlands in certain regions emitting more methane than in others?
There is a large latitudinal gradient in wetland methane emissions. The fluxes are larger in the tropics than in the high latitudes and temperate zones. It’s a lot warmer in the tropics, so you get a lot of biological activity and more production of methane than from the high latitudes where it’s really cold. We’ve estimated annual emissions totaling over 110 million tons from tropical wetlands versus about 10 million tons from the high latitudes.
That pattern is not surprising and has been recognized for a long time. Also, those emissions are natural, so they will continue, as long as we don’t drain the wetlands, which does happen.
Q. Do you expect emissions from wetlands to increase in the future?
Our simulations suggest that methane emissions will continue to increase as the world warms and atmospheric carbon dioxide concentrations increase. Our group is participating in ongoing GCP efforts to synthesize these types of future estimates from several of the global modeling groups.
Q. What are your next steps in improving the estimation capabilities of your current model?
We’re thinking about using machine learning tools to help build relationships between wetland methane emissions and all the factors that we think control these emissions. The input will be emissions data collected at the FLUXNET wetland sites along with other relevant variables – wetland characteristics, vegetation, climate – pertaining to these regions. Once you know the relationship strengths between these variables and methane emissions, you can extrapolate them to other wetland sites for which we don’t have emissions data. Of course, this type of approach will require testing at a subset of sites where benchmarking observations are available to ensure the appropriateness of regional to global extrapolations.
We also are interested in integrating these types of observationally constrained machine-learning models with the more mechanistic models, with the hope of improving the overall predictability of the global representations.


