Europe is a very heterogeneous continent in many ways, and water is no exception.
Customs, legislation, economy or population density are some of the factors that affect the water cycle in different countries, and that make, for example, that a Swiss consumes 263% more water than a Slovakian or that a Danish pays 8700% more for water than a Bulgarian.
These data, provided by the European association of urban water cycle managers EurEau, which includes 29 European countries, allow us to have a global vision and to compare the different countries.
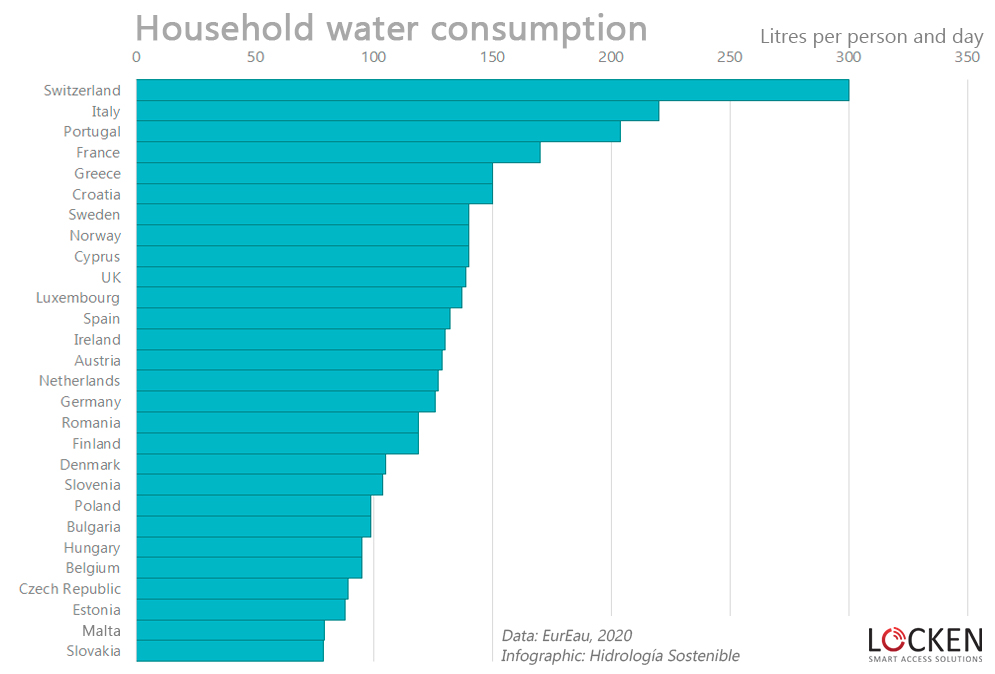
Household water consumption
Factors such as the type of housing, climate and habits can affect the average amount of water consumed per person.
Although there are four countries that exceed the average of 150 litres per person per day, with a surprising figure of 300 litres in the case of Switzerland, most of them are between 78 litres in Slovakia and 150 litres per person per day in Greece.
The UK ranks tenth from the top with 140 litres per person per day.
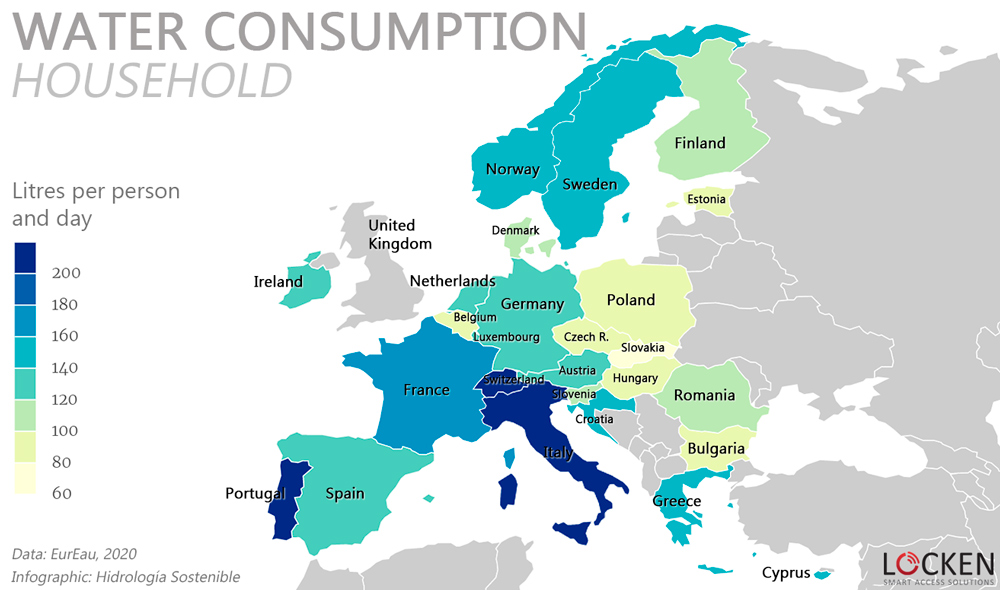
Represented on a map we can see how the countries of eastern Europe are the ones with the lowest consumption. In fact, there seems to be a gradient from eastern to western Europe, from lower to higher consumption.
Water prices
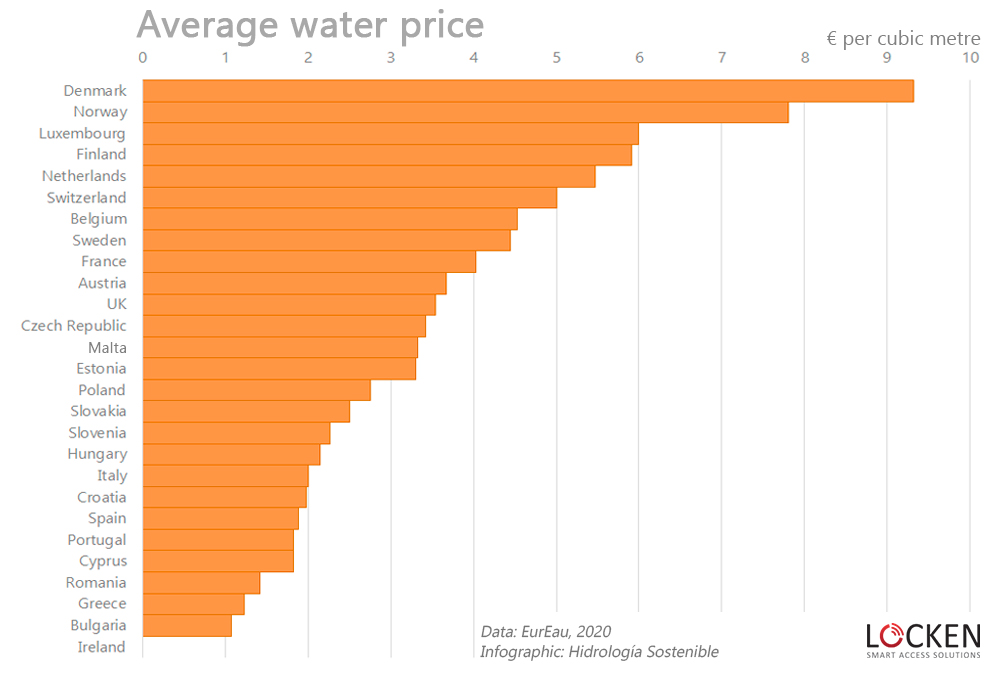
The average price of water for household use in Europe is highly variable.
It is highest in Denmark with 9.32 €/m3, followed by Norway with 7.8 €/m3.
The UK is in the middle of the ranking, with an average price of 3.5 €/m3.
Among the countries with the cheapest water are Greece with 1.23 €/m3 and Bulgaria with 1.07 €/m3.
We even have a country like Ireland, where due to historical reasons consumers do not pay a bill directly, although as in all countries, what is not collected directly has to be financed through taxes. One might think that this encourages water consumption, but this is not the case if we look at the previous ranking, in which Ireland’s household water consumption is in the middle of the ranking.
Geographically we see how the price ranges are grouped by zones. An outer ring in which Spain and Portugal are located, with cheaper water, a zone from Poland to Italy, with a medium price and a band from Finland to France with medium or high prices.

Price modified according to the cost of living
But these prices are influenced by a variable that can distort the ranking a bit: the cost of living in each country. Prices in countries with a higher income and a higher standard of living will tend to be much higher than in other countries.
To try to minimize this factor as much as possible and to make comparisons "fairer", we are going to modify these prices according to the cost of living in each country, adjusting them to the UK. In this way, the price in the UK remains unchanged, while the others are increased or reduced depending on the difference in the cost of living with the UK.

Norway has now the highest price, as it seems that part of the high price of water in Denmark was due to the high cost of living there, although it is still in second place.
In some countries, the change of position with respect to unchanged prices is more striking, as is the case of Malta, which rises from the middle of the table to third place.
The UK, which was in the middle of the ranking but closer to the top, drops down a few places to the lower third of the ranking. Bulgaria continues to be the country with the cheapest water in Europe, aside from the particular case of Ireland.

We now see more differences between nearby countries, such as Sweden and Norway. In general, we see a clear trend towards higher water costs as we move further north.
Water supply network
The length of the supply network, expressed as metres of pipe per person, can be influenced by the population density of each country and by the percentage of population served, which in the case of most of Europe is a very high percentage.
In first position we have Finland, with 19.5 metres of pipe per person, and in last position Romania with 4.3 metres. This last position is due in part, to the lack of water supply coverage in Romania, which according to EurEau in 2016 was 62%.
The UK is in the lower third of the ranking, with 6.4 metres of pipe per person.

If we look at the length of the water supply network, we see no obvious pattern in the map of Europe.

Sanitation network
In the same way as with the water supply network, we now look at the metres of sewer pipe per person.
In this case, the winner by far is Ireland with 19.1 meters per person, and in last position, Romania with only 1.96 meters. This last position, as was the case with supply, is due to the lack of coverage, which according to EurEau in 2016 was only 46%.
In this case the UK is in the middle of the ranking, with 6 metres per person.

Concerning the geographical distribution, once again we see a very heterogenous pattern when we look at the length of the sewer network in the map of Europe, as it was the case with the length of the water supply network.

Many factors can affect the urban water cycle, and drawing conclusions is sometimes not straightforward. But by comparing different countries, we can at least have reference points and see more tangibly what the situation is like in a particular country.
References
- The governance of water services in Europe 2020 edition. EurEau.
- Cost of living: Numbeo.com, 2020


.")